


Next: References
Up: Marked Point Processes in
Previous: Simulation of the Typical
In this section we discuss some point-process models whose realizations
exhibit clustering and regularity respectively. Assume that the
underlying point process X is stationary and isotropic (with intensity
 ). Then these two kinds of deviation from complete spatial
randomness of points can be studied for example by means of the reduced
second-order moment measure K of X, which is uniquely determined by
(2.9).
Since X is not only stationary but also isotropic, K is
isotropic as well and it suffices to consider the reduced
second-moment function K(r)=K(b(o,r)), where b(o,r) is the
circle with radius r and center at the origin o; see
Section 2.2.
Closely related characterstics are the product density
). Then these two kinds of deviation from complete spatial
randomness of points can be studied for example by means of the reduced
second-order moment measure K of X, which is uniquely determined by
(2.9).
Since X is not only stationary but also isotropic, K is
isotropic as well and it suffices to consider the reduced
second-moment function K(r)=K(b(o,r)), where b(o,r) is the
circle with radius r and center at the origin o; see
Section 2.2.
Closely related characterstics are the product density
|  |
(1) |
and the pair-correlation function
|  |
(2) |
provided that the function K(r) is differentiable; r>0.
In accordance with the interpretation of  as the
expected number of points in a circle with radius r and center
at the typical point of the point process,
we can interpret g(r) as 'relative frequency'
of pairs of points having distance r.
Note, that in the Poisson case (2.9), (2.8),
(6.1) and (6.2)
imply that
as the
expected number of points in a circle with radius r and center
at the typical point of the point process,
we can interpret g(r) as 'relative frequency'
of pairs of points having distance r.
Note, that in the Poisson case (2.9), (2.8),
(6.1) and (6.2)
imply that  ,
,  ,and g(r)=1 for all
  .Although this extremely simple relationship will not be true for the more
general point-process models discussed below, we still can determine
their pair correlation functions. Thus, statistical model identification
can be based on comparison of empirical pair-correlation functions
with given theoretical counterparts. In particular, for small
r > 0, values g(r) > 1 indicate clustering whereas values
g(r) < 1 indicate inhibition of points, relative to the
situation for the homogeneous Poisson process.
.Although this extremely simple relationship will not be true for the more
general point-process models discussed below, we still can determine
their pair correlation functions. Thus, statistical model identification
can be based on comparison of empirical pair-correlation functions
with given theoretical counterparts. In particular, for small
r > 0, values g(r) > 1 indicate clustering whereas values
g(r) < 1 indicate inhibition of points, relative to the
situation for the homogeneous Poisson process.
Suppose that a stationary and isotropic point process  with intensity is observed in the convex window
 ;
;  . Then, the product density
 defined in (6.1) can be estimated by
using an edge-corrected density estimator of the form
defined in (6.1) can be estimated by
using an edge-corrected density estimator of the form
| 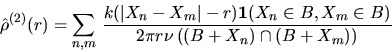 |
(3) |
where k(s) is a nonnegative function and the summation extends over all
pairs (n,m) such that  and
and
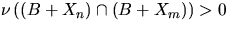 .
Usually one assumes that k(s) is a kernel function, i.e.
k(s) is a probability density which is symmetric about the
origin and vanishes outside a bounded interval. A suitable example of a
kernel function is
.
Usually one assumes that k(s) is a kernel function, i.e.
k(s) is a probability density which is symmetric about the
origin and vanishes outside a bounded interval. A suitable example of a
kernel function is
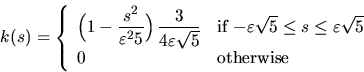
for each fixed smoothing constant  ;see Stoyan et al. (1995), Stoyan and Stoyan (1996).
In Collins and
Cressie (1996), local versions of the product density
have been considered which are associated with each
individual point of the process X provided that this point lies in B.
These local density functions are then grouped into bundles
of similar functions. In this way the (clustering or regularity)
structure of the observed point patterns can be quantified.
;see Stoyan et al. (1995), Stoyan and Stoyan (1996).
In Collins and
Cressie (1996), local versions of the product density
have been considered which are associated with each
individual point of the process X provided that this point lies in B.
These local density functions are then grouped into bundles
of similar functions. In this way the (clustering or regularity)
structure of the observed point patterns can be quantified.
In Figure 14 a realization of a homogeneous Poisson process
and g(r)=1 together with the estimator
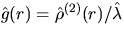 are given, where
 is an estimator for the intensity; see
Section 2.2.
is an estimator for the intensity; see
Section 2.2.
Figure 14:
Homogeneous Poisson process
|
Next: References
Up: Marked Point Processes in
Previous: Simulation of the Typical
Andreas Frey
7/8/1998